|
Thanks for Champlian Collage Digital Forensic Association to put up unofficial DFIR 2019 CTF for us. You can download the image from this dropbox link: https://www.dropbox.com/sh/4qfk1miauqbvqst/AAAVCI1G8Sc8xMoqK_TtmSbia?dl=0 CTF Link: https://defcon2019.ctfd.io/ In this post, I am only covering the "Memory Forensics Section" of the Defcon DFIR 2019 CTF. I'll be doing other posts for the other parts of the Defcon DFIR 2019 CTF. I am using Volatility to do this challenge but feel free to use the tool of your choice. Some of the questions are complex, please try it and feel free to contact me if you have any questions, Happy to help! 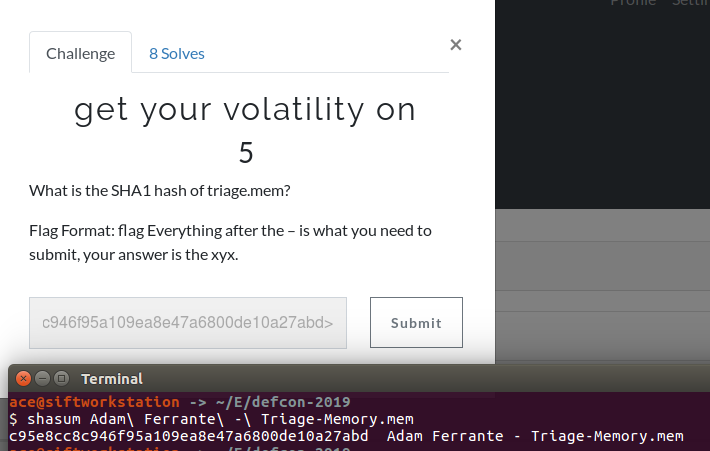 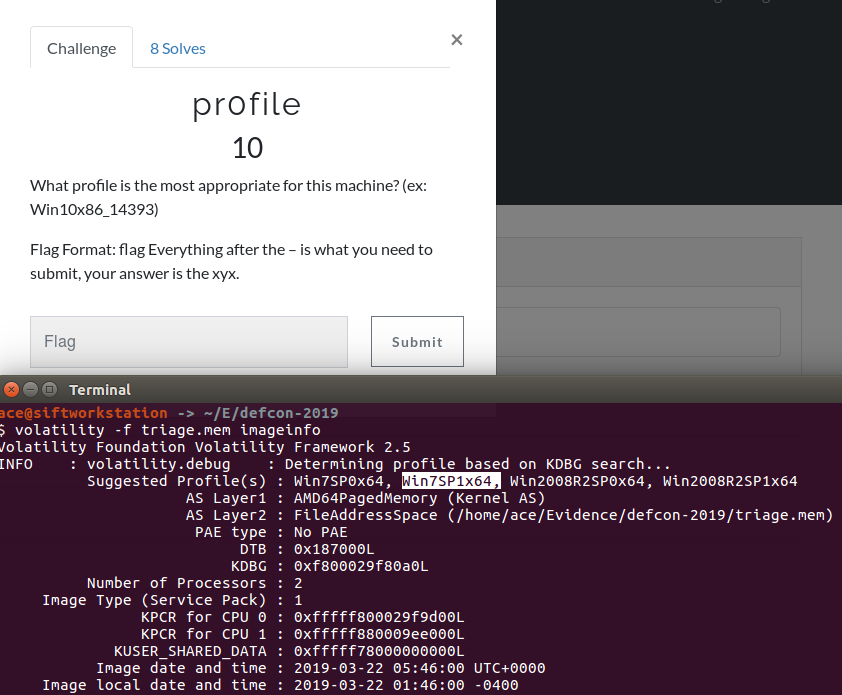 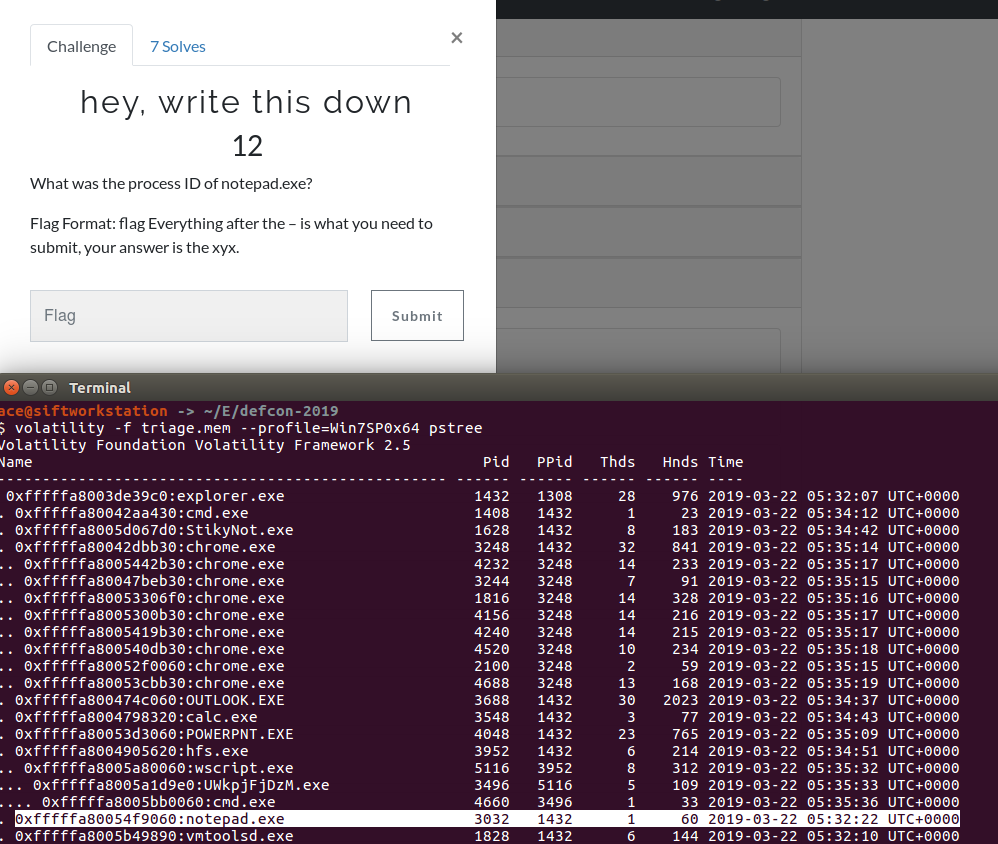  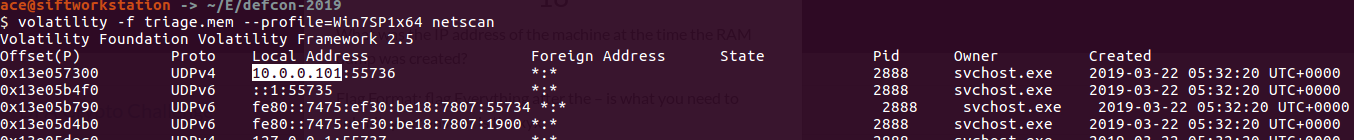    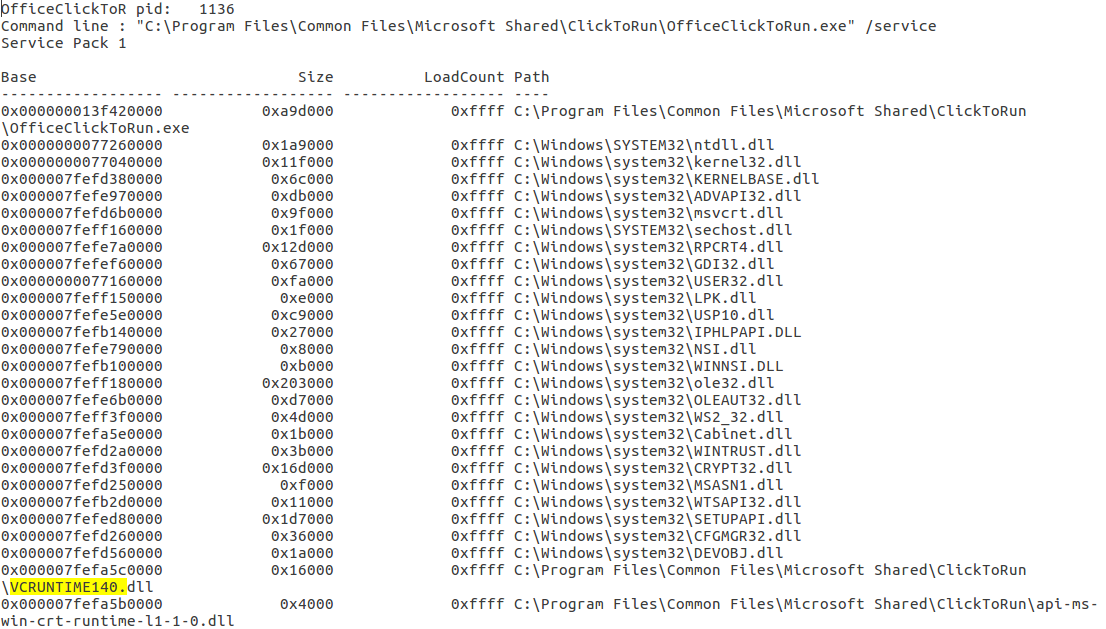             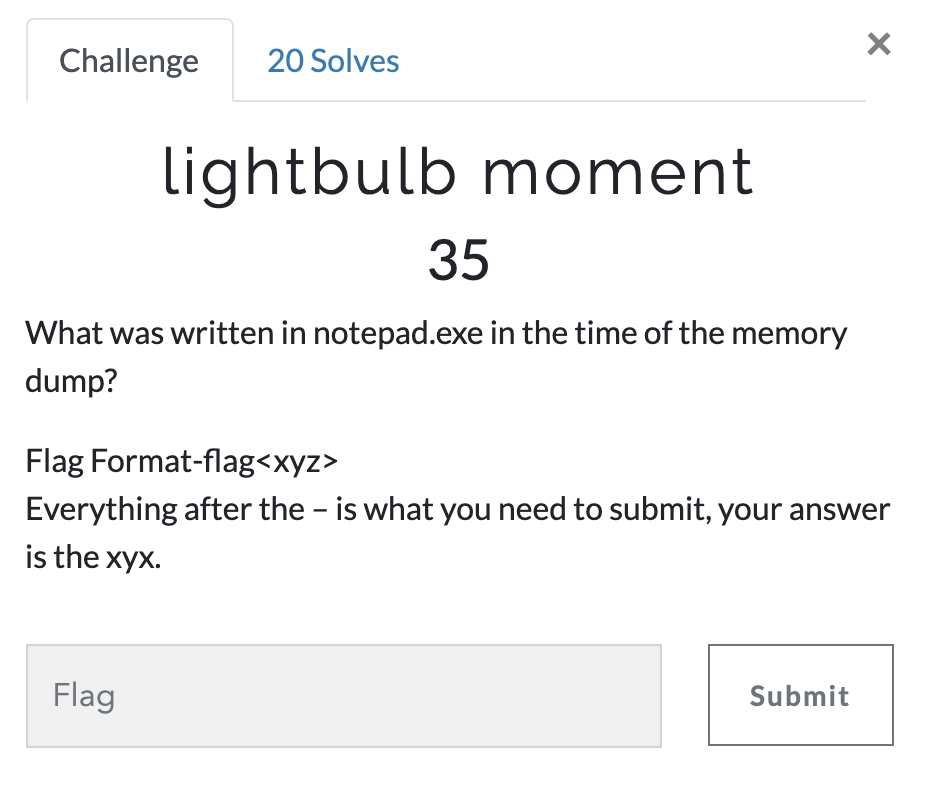 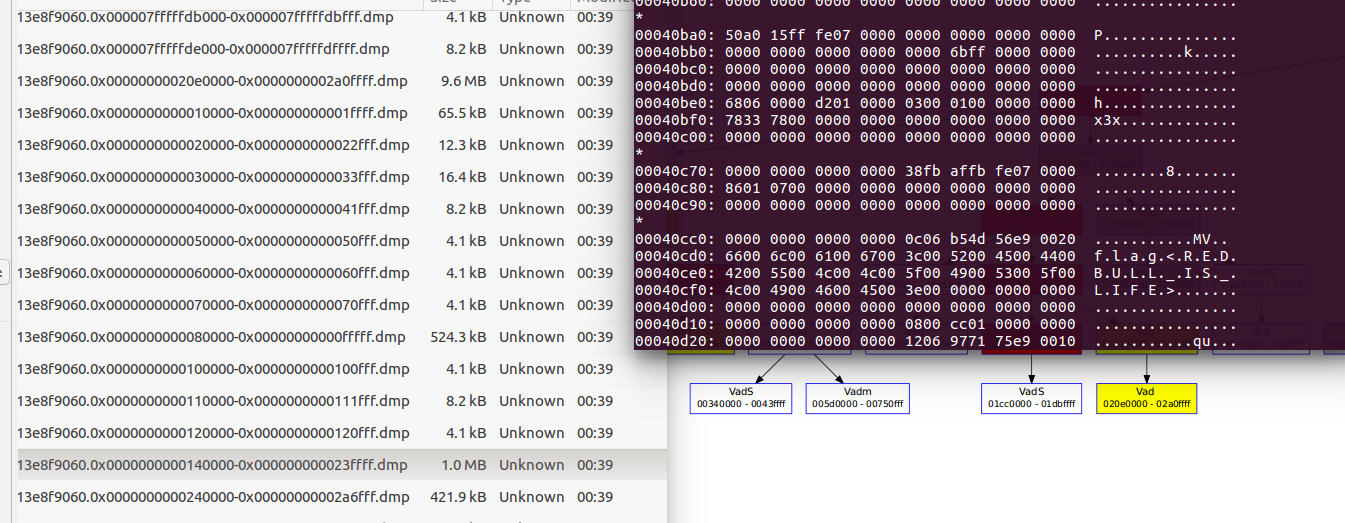 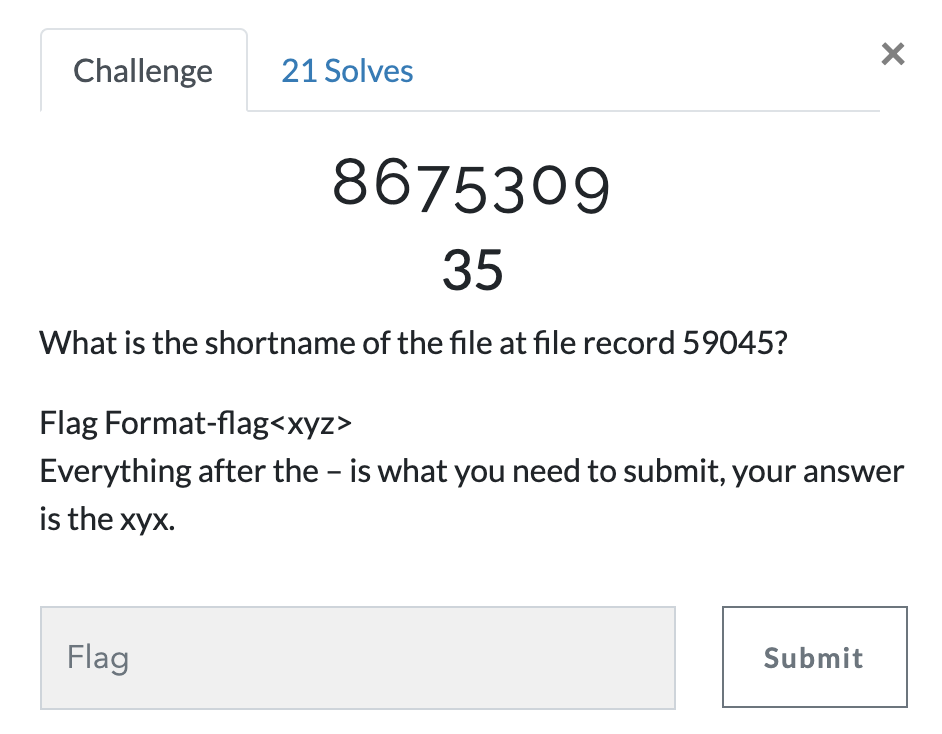 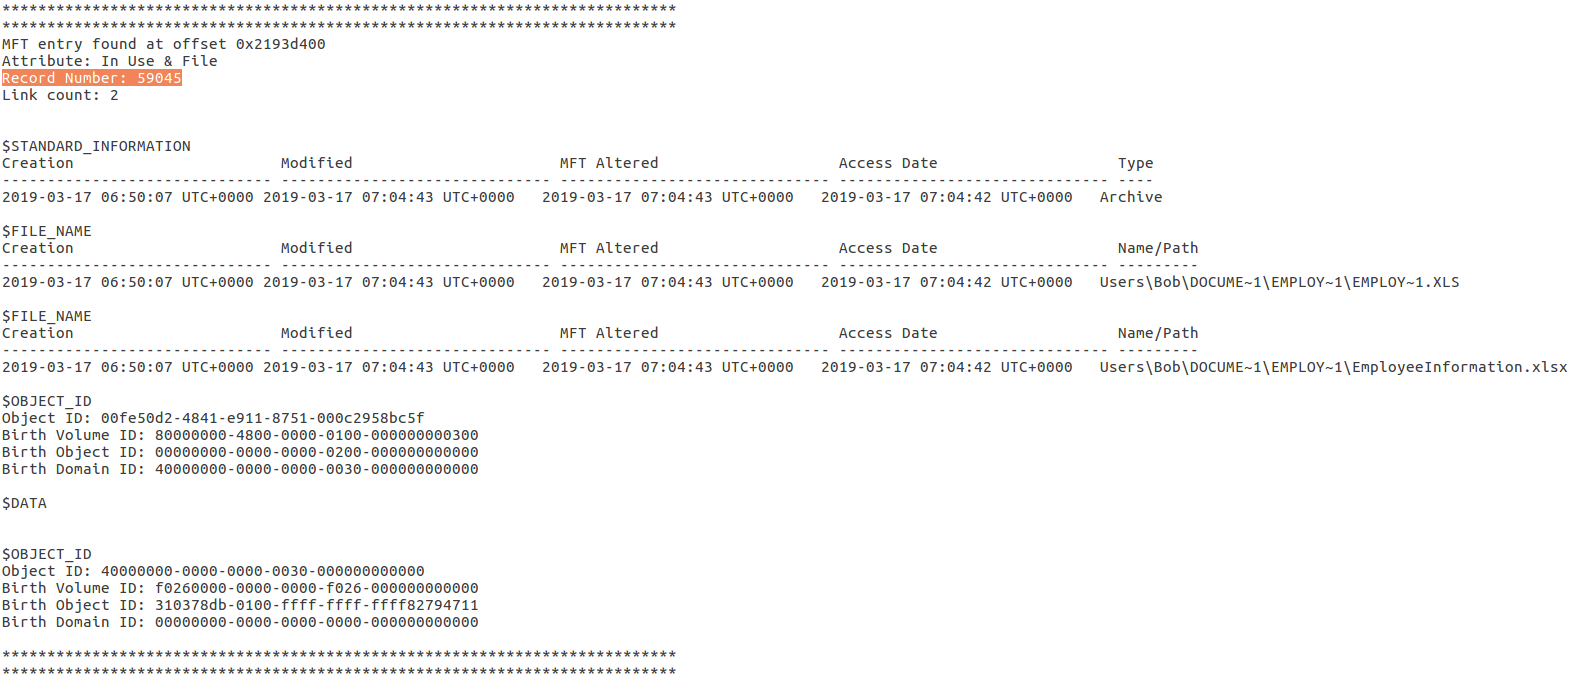 flag<EMPLOY~1.LNK>    In windows world, hyberfile.sys file gets created when the system goes in hybernation mode (When Lid of you Laptop is down). It stores the current start of the memory. Think of it as a 'Snapshot' of memory. Forensic Value: The file has immense forensic value. Even if you are performing a deadbox forensics on a system - you'll be able to analyze the memory data. If you are performing a live forensics - you'll have two copies of memory: one is the current one and there other from the hyberfil.sys file. Volatility imagecopy command allows you to convert any existing type of address space (such as a crashdump, hibernation file, virtualbox core dump, vmware snapshot, or live firewire session) to a raw memory image. Windows 8/10 use a hybrid hibernation file format, Upon wake up, hibernation file is deleted. Fast Startup logs out of current user, reducing hibernation file size (for faster startup), records less artifacts. See page for default sizes, supports and file types.
Memory Acquisition Tools for Windows
For Linux System
Running process information: Rogue processes such as rootkits-based malware can be detected via memory forensics.
Passwords: It's easy to find the password (clear text) in memory Contents of open windows: This is a piece of crucial information to learn about the user's current state. Network Connection Information: Finding Exfiltration & C2 (Command and control) can be found here. We are all aware of things like TLS etc. The best way to get the decrypted version of the information is in memory. Memory images can contain the contents of many processes, activity and files; including Internet Chat History. BIOS settings and VSS files (stored on user's hard drive) are not present in the memory image!Pretty much everything in the Operating system goes through Random Access Memory (RAM). Data available in the RAM is of immense value.
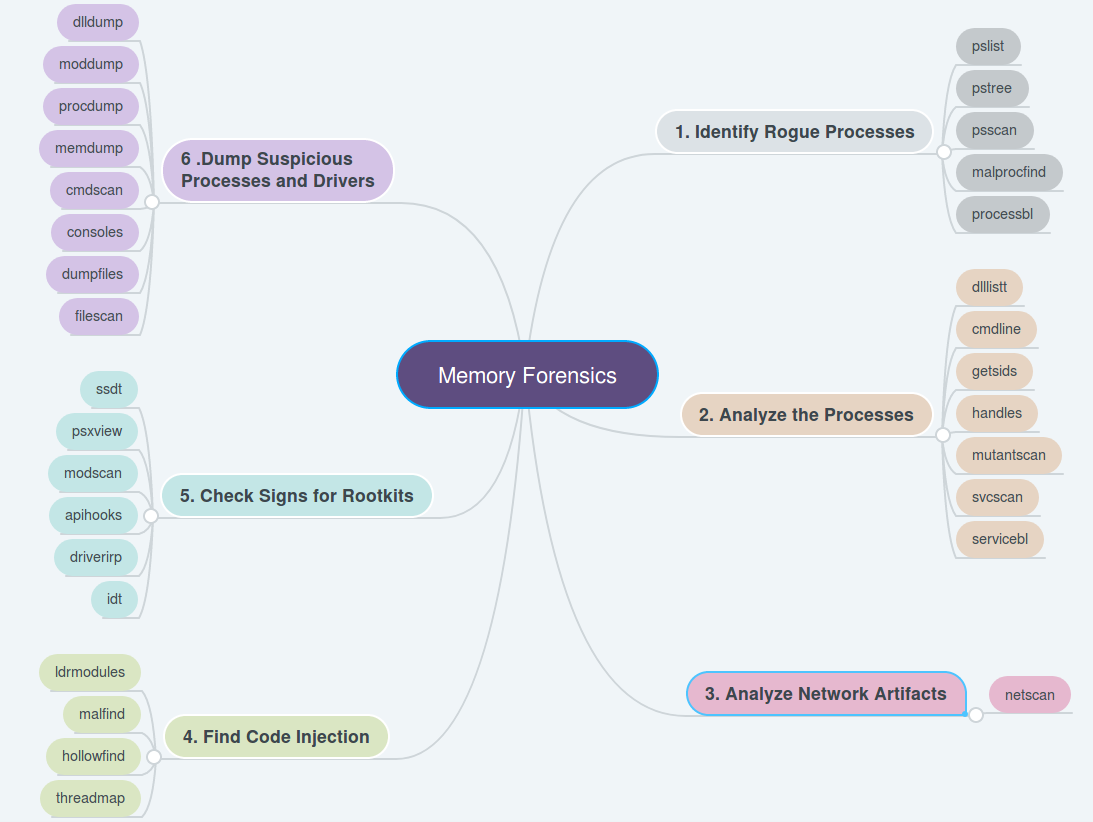
In order to understand a memory process, we need to understand the following terms: 1) DLL's: Dynamic Linked Libraries, this will define the capabilities of the process. Modern day malware uses it's own DLL's to take control of the process. 2) Handles: A pointer to resource . There are many pointers like file pointer, directory handles, Registry handles, Mutex, Event handles. 3) Threads: This of process as a box that will have all the items to do the work. Many threads will run to get things done within a process. 4) Sockets: Network connections endpoints. Helps us in tracking back the network activity of a process. # Analyzing DLL's By analyzing the loaded dlls in a process we can answer questions like - what process was doing? You can use another plugin called dlldump to carve out dll's for more analysis. use ldrmodules for more detailed analysis of the dll's DLLLIST 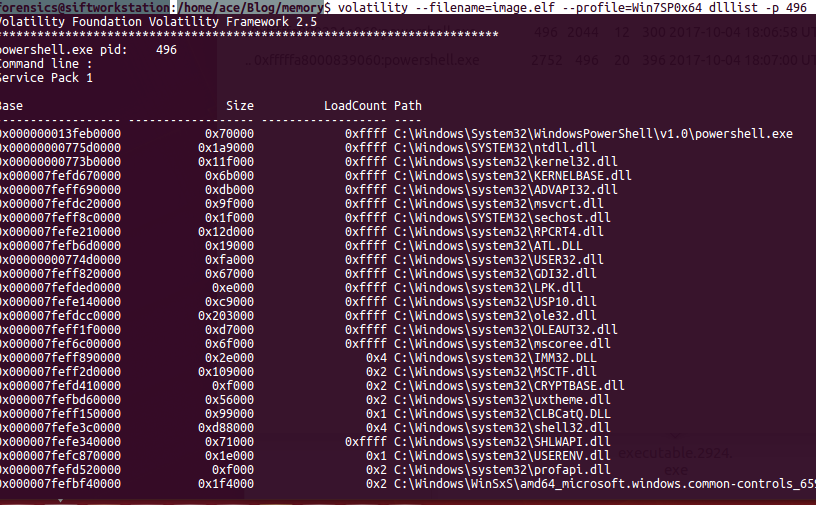 getSIDS - Security Identifiers This will give the information about the about the processing spawning and permissions. Every processes in spawned by an account and every account has some permissions. Most system processes are spawned by system account itself. This will help in identifying malicious process. 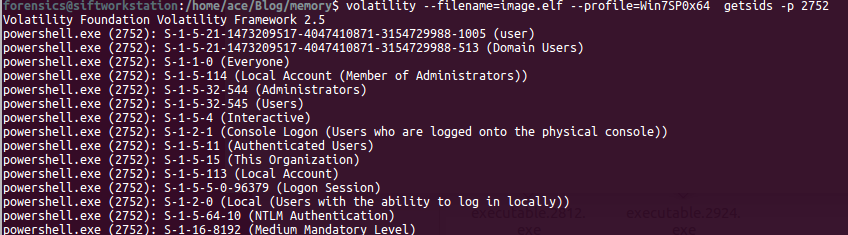 Link:https://support.microsoft.com/en-us/help/243330/well-known-security-identifiers-in-windows-operating-systems HandlesEach process can have multiple types of handles. use -t flag to find specific type of handles. 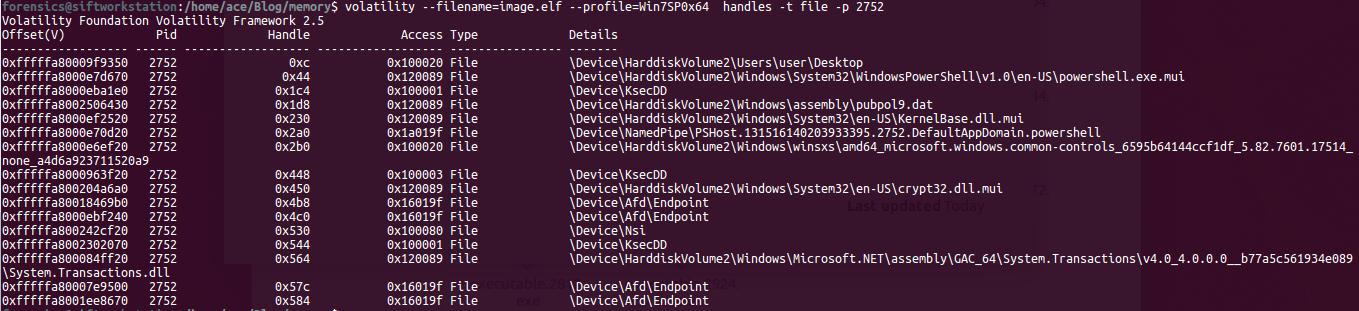 -t Mutant Modern Malware uses Mutant to tag a processes as captured. Excellent IOC. Look for keywork "Mtx" Svcscan Mainly used by malware to maintain 'Persistance' (ability to survive reboot) 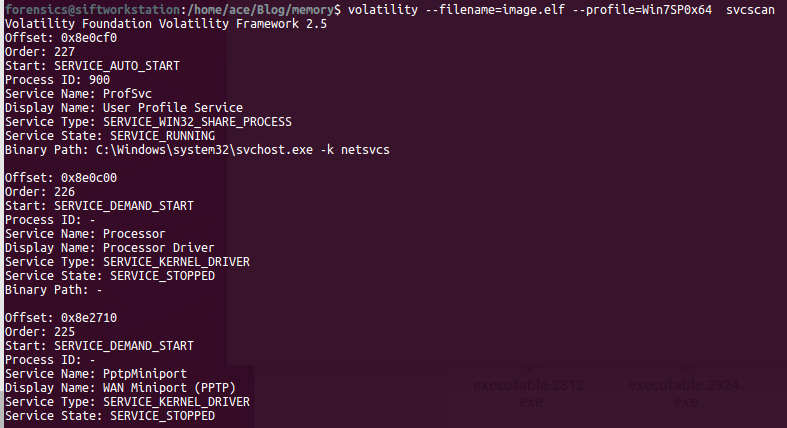 Analyzing Memory images with the tools like volatility is easy. Traditionally there are only few ways to identify a malware in a system like signature, contradiction and behavior. The key question is where to start you analysis. As an investigator, it's critical to have an structured though process before starting an investigation. Personally, I like to start with analyzing the processes. Processed will give us information about what was running on the system. The metadata of processes are in Executive Process Block or Eblock like name of the process, process identifier(PID), Parent PID, Offset (location in the memory) etc. The kernal uses DLL (Doubly Linked List) to track processes. Only running processed will be found in the list. There are other commands in volatility to review the unlinked processes as well.
There are three key plugins available to review the processes: 1) pslist - show all running processes (Not orphaned). quick results 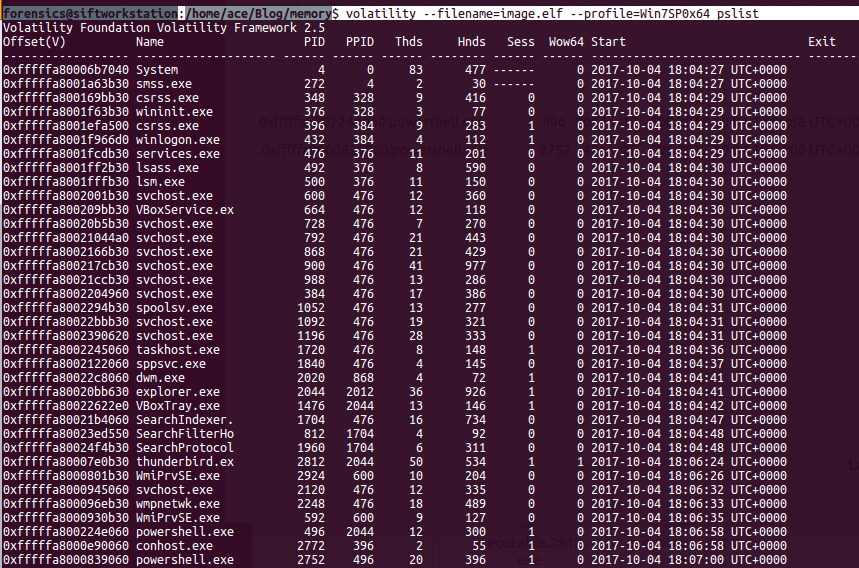 2) Psscan - Comprehensive scan of memory may identify the not running processes. 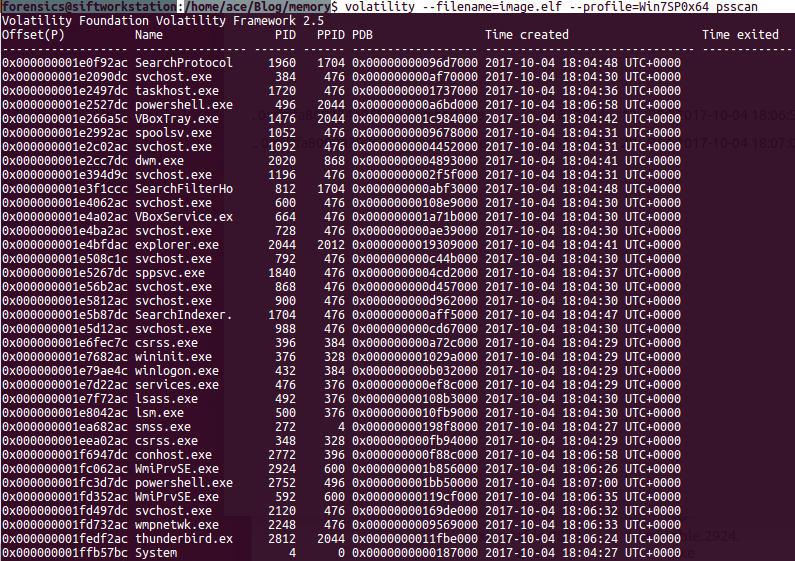 3) pstree- print process list as a tree (very useful). You can also use -v flag for more verbose output. 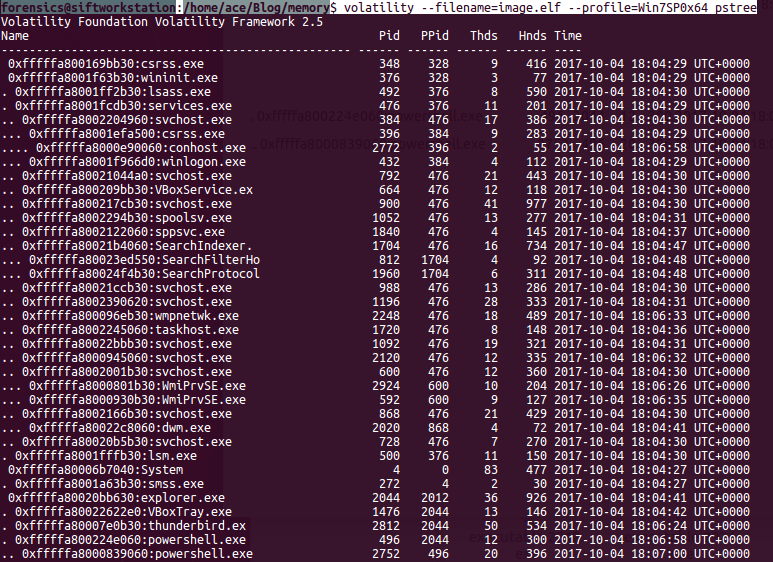 Help Command 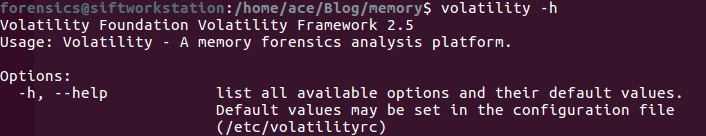 Image Info: We often use imageinfo to identify the profile(s) of a forensic memory image but you can also get the information about the image date and time in UTC. 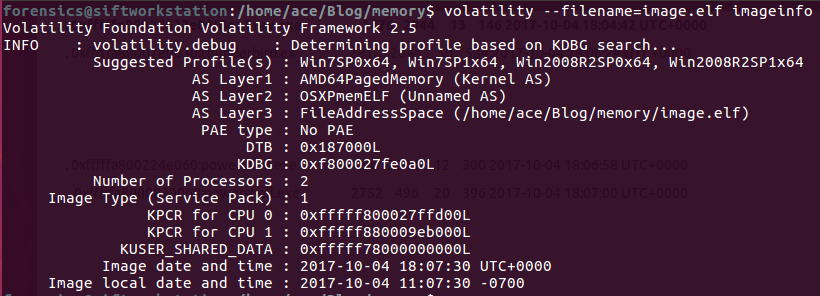 Once you've identified the right profile; in this case it's Win2008R2SP1x64. You can choose to set it as an environment variable:
export VOLATILITY_PROFILE=Win2008R2SP1x64 You can use unset command to remove it too: unset VOLATILITY_PROFILE Study of volatile data (RAM) of a system is Memory Forensics
Analysis includes the RAM and Page file data The data is more like a snapshot in time There are three main phases:
|
Archives
August 2019
Categories |
 RSS Feed